
This site was funded by

Introduction
Staff know that we have an anticipatory duty towards students and an obligation to make 'reasonable adjustments' however, this presupposes that all teaching staff understand the features of a range of disabilities and are able to factor this in to their teaching. The purpose of this training is to fill this gap by highlighting some of the barriers faced by students with impairments and the simple things we can do, as a matter of course, to make our teaching accessible.
There is considerable disagreement both within the literature and amongst disabled individuals about the most appropriate terminology to use in respect of disability. Throughout this training resource I would be using vocabulary that distinguishes between an individual’s impairment and the disabling effect of the actions, or inactions, of society.
At various points in this resource there will be a ‘student quotes’ these quotes are taken verbatim from a survey I am running across Exeter’s campuses about the experiences that students with impairments have at the university.
Training site map
You can navigate the site by either clicking on the “next” button at the bottom of each page, or by using the table of contents on the left hand side. On the right hand side of each page there is a list of the impairments that most commonly occur in the student body; this is background material and provides information on the prevalence of each category of impairment and the summary of how such impairments might typically effect a students’ teaching and learning experience and their performance in assessments.
Rationale of this resource
The objective of this resource is to highlight some of the barriers faced in-class by students with the most commonly occurring disabilities, and to illustrate the simple changes that you can make to your classes, and teaching material, that can help reduce or eliminate such barriers. I will not be considering the adaptations required for students with multiple complex needs as these would necessarily have to be addressed on a case-by-case-basis. I will be focusing upon the barriers that teaching staff can reduce or eliminate, rather than factors that are typically outside of the control of teaching staff such as the University’s physical infrastructure.
Background
Globally it is estimated that 15% of the population live with a disability (WHO 2011)[1]. Likely due to higher than global averages of diagnosis rates and longevity, in the UK it is estimated that 22% of the general population, and 19% of working-age adults, have an impairment of some form.
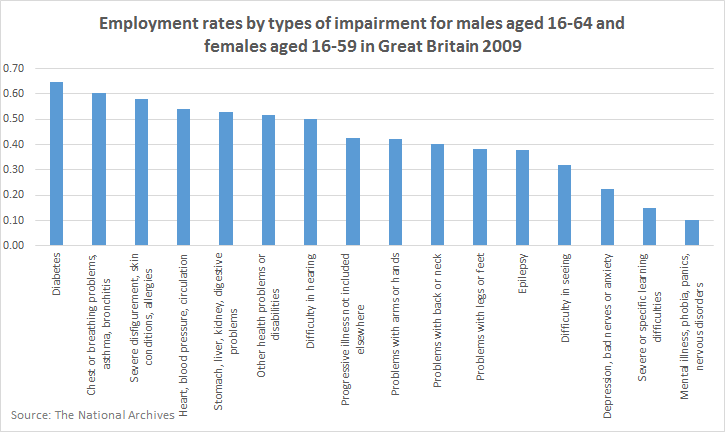
The UK performs poorly, when compared to similarly developed European countries on measures of the employment rate for individuals of working age who have a disability.[2] In the UK 48% of people who have an impairment are employed versus 75% of those without a disability; this difference is 8 percentage points higher than the European average (Eurostat 2015). HE has an important role in the education and employability of all students, but it is especially important to address the employability of students with impairments, and to do this we must address barriers to learning.
According to the DWP (2018) in the Family Resources Survey 2016/17, between 2002/3 and 2009/10 the participation rate in HE by students, aged 19 with an impairment, has risen from 18% to 33%, however this still lags behind the participation rate for their non-impaired peers which was 32% in 2002/3 rising to 41% in 2009/10.
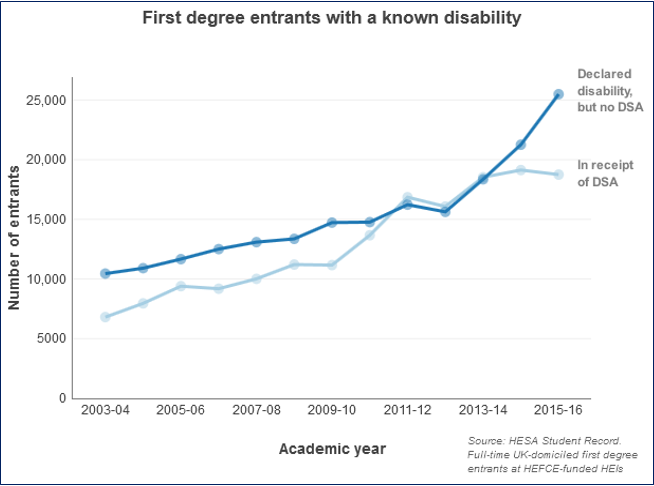
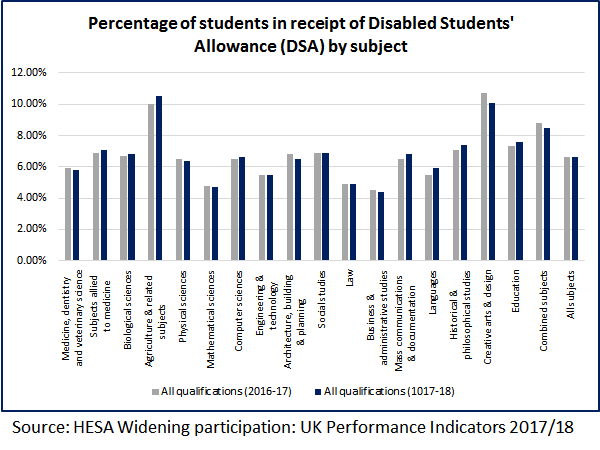
HESA (2017) estimate that approximately 12% of enrolled students have a known disability and 6.6% of home students are in receipt of Disabled Students’ Allowance.
According to the Equality and Human Rights Commission the number of people with an impairment, aged 25 to 64 in GB, who have a degree level qualification is significantly different (at 1%) from the number of non-disabled individuals who hold degree level qualifications.
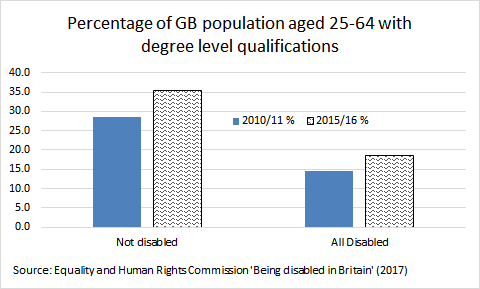
The same study shows that there are also significant differences (at 1%) between the percentage of nondisabled people holding degree level qualifications and their disabled peers when the data is split by disability.
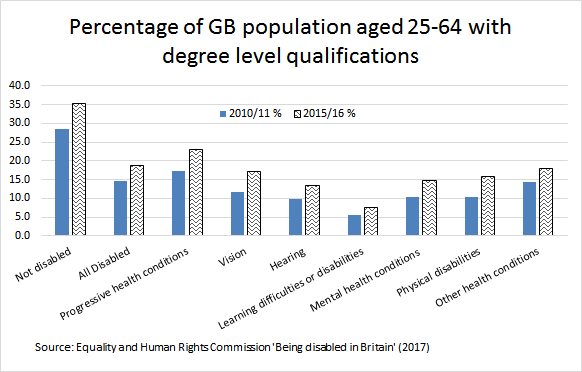
While we might expect the overall participation rate in higher education to be slightly lower amongst disabled individuals than the nondisabled, because some disabilities do effect intellect, we can see that there is still a lower participation rate, among individuals with disabilities that do not affect intellect, than the participation rate of the nondisabled.
Madriaga (2007), citing the National Disability Team and Skill (2004) report, says that the underrepresentation of people with disabilities in the student body was due to three main factors: a lack of knowledge about higher education, insufficient skills to enter higher education and inadequate practical, procedural and financial support.
Training teaching staff about how to make their teaching accessible is especially important when we consider the rising proportion of students with disabilities accessing HE. In 2011/12.9% of the student body declared a disability rising to 11% in 15/16 (HESA 2017). Evans et al. (2017) suggest that this is likely to be due to improvements in the school sector, enabling more students with impairments to enter HE. Fuller et al. (2004) and Healey et al. (2001) estimate that the true number of students with disabilities may be higher than official estimates because of a reluctance by students to officially declare their disability status.
Additionally, there is evidence that students declaring a disability have lower completion rates and degree classifications and the non-impaired peers (Richardson et al. 2003).
Woodfield (2014), using HESA data from 2014, found that sector-wide 66% of students with impairments obtained an upper degree, compared to 65% of non-impaired students. However only 63% of students in the largest sub-group of impairments (learning difficulties) obtained an upper-degree. There were also noticeable differences between the relative performance of impaired and non-impaired students between disciplines. In all disciplines bar Business and Management, Economics, and Finance and Accounting, students with impairments, on average, were less likely to obtain an upper-degree than their non-impaired peers, with the biggest difference in performance exhibited in the disciplines of Languages, Medicine and Dentistry, Music, Dance and Drama, Psychology, and Veterinary Medicine.
In their summary of the literature, Orr and Hammig (2009) find that there have been increasing numbers of students with disabilities attending higher education, but they have lower retention and completion rates than their nondisabled peers with many students with disabilities dropping out during the first year. Factors contributing to higher attrition rates amongst students with impairments include a lack of ‘academic preparation’ and ‘transition support’ as well as insufficient support whilst in higher education because of a lack of knowledge on the part of academic staff on appropriate teaching modifications. They also report evidence that teaching staff are themselves concerned that they do not have enough training or knowledge to effectively teach students with impairments.
Similarly, Brandt (2011) says that teaching staff need more training in disability awareness and that this may involve either cultural change or simply more information on why a student might need an adjustment, for example they quoted a blind student who stated “faculty have no idea what it’s like to be a student with a disability”. I aim to address this deficit with this training resource.
Evans et al. (2017) say that current practice within Higher Education tends to look at ways of mitigating the impact of a student’s disability, for example through the use of extra time in exams and extended deadlines. These individual based modifications or adaptations are time-consuming and can be costly; it would be far more effective to deliver teaching and assessments in ways that are accessible so that individual mitigations would not be required.
The most common forms of disability in HE
The most common type of disability reported by students in HE is a specific learning difference, such as dyslexia, dyspraxia or Attention Deficit Hyperactivity Disorder. In 2015-16, almost half of those students with a known disability who started a higher education programme had a specific learning difference.
There have been considerable increases in recent years in the number of students with a known mental health condition. This increased by 220 per cent between 2010-11 and 2015-16. [3]
Why accessibility benefits all students
Given the incidence of impairment amongst the general population it is highly unlikely that there will be no students with an impairment in a typical lecture, even if you have not been made aware of their presence. Not all individuals will have been diagnosed and many students choose not to disclose their impairment for a variety of reasons including the fear of being stigmatised. For example, Pope et al. (2007) estimated that, due to possible under diagnosis, up to two-thirds of students who exhibited characteristics of dyslexia and/ or ADHD did not receive any learning support at all.
The rates of disability diagnosis also vary internationally as a function the stigma of disability, wealth and the degree of a country's development.
Accessible course design, delivery and assessments will benefit all students for example, current research suggests that speech perception, for people, with and without hearing loss is a function of both visual and auditory clues; that is, people with no hearing loss, unconsciously lip-read to some extent. [4]
Brandt (2011) reviews literature that demonstrates that non-disabled students face similar barriers to those that disabled students do. However, the impact on disabled students can be much more pronounced; for example, delays in providing module reading lists will affect all students, but the impact upon students who need material in accessible formats will be more pronounced because of the time taken to convert reading material into a format that they can access.
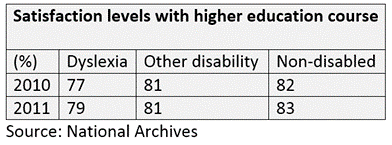
The government’s Disability Equality Indicators, using NNS data, demonstrate that students with impairment(s) are less satisfied with their course than their non-impaired peers.
References
[1] http://apps.who.int/iris/bitstream/handle/10665/70670/WHO_NMH_VIP_11.01_eng.pdf;jsessionid=0D5425B9059E0E4F73B1AA2860C59BCF?sequence=1 13/11/18
[2] http://webarchive.nationalarchives.gov.uk/20131101163230/http://odi.dwp.gov.uk/disability-statistics-and-research/disability-equality-indicators.php 13/11/18
[3] Defined here as a ‘basic activity difficulty’ https://ec.europa.eu/eurostat/statistics-explained/images/8/8c/Infographic_Disability_statistics_final.png 13/11/18
[4] Adapted from http://www.hefce.ac.uk/analysis/HEinEngland/students/disability/
[5] https://onlinelibrary.wiley.com/doi/full/10.1080/13682820802090281 13/11/18