Scour maps in single-pier experiments with a log debris at free surface (top) and on bed (bottom). Flow is from left to right.
Scour maps in single span-arch experiments with and without log debris . Flow is from right to left.
Followings are a few photos showing our recent activities in flume experiments (flow is from right to left).
Following photo illustrates pressure sensors embedded in a pier model for measuring hydrodynamic pressure (acoustic Doppler velocimeter (ADV) can be also seen on the left side).
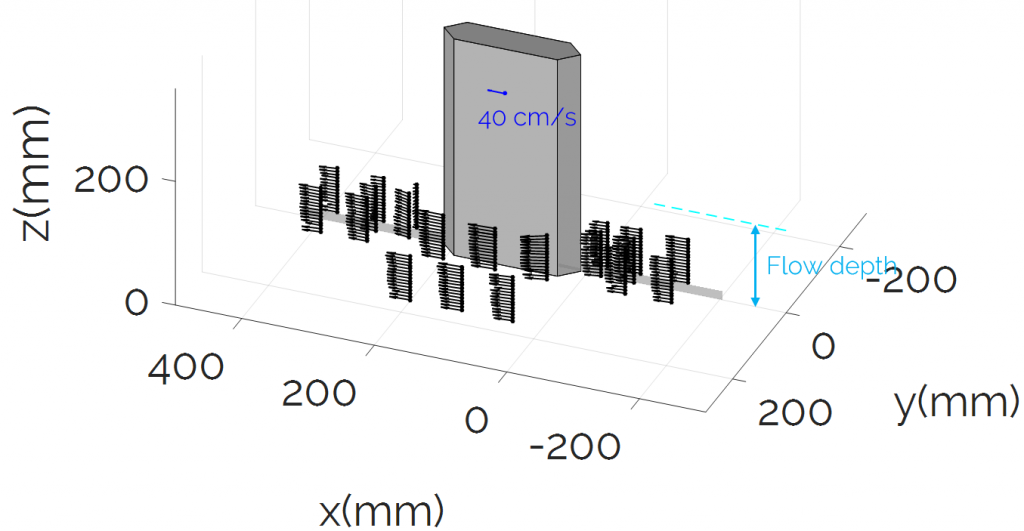
Velocity vector field measured around a pier using ADV. 
Power spectral density plot at a point adjacent to the bridge pier.
Scour protection using riprap around a pier blocked by a log debris (not shown in the image). Flow is from left to right.


