On 21st November 2019, a webinair about scour at bridges has been presented by CIRIA with the aim to update the existing Scour Guidance CIRIA C742: Manual on scour at bridges and other hydraulic structures (2015). Dr Prakash Kripakaran presented the results from research at the University of Exeter and how these have been included in scour assessment practice within the framework of Highways England’s BD97/12. The webinair can be accessed here.
Category Archives: Project phases
Computational modelling
Reply
This phase will focus on the application of CFD to predict hydrodynamic effects of debris blockage for a broad range of bridges. We will evaluate computationally the two main hydrodynamic effects on a bridge, namely scour and pressures. Two distinct approaches to modelling scour will be investigated and later compared for their effectiveness. Results from the flume experiments in Phase 1 will be used to test and validate the CFD models. Accuracy and computational costs of the two distinct approaches for scour prediction and modelling will be assessed to determine the most suitable approach for the next stage of the project.
Scour depths will be empirically related to flow velocities near piers or abutments based on results from the scour modelling approach identified as the most suitable for scour prediction. We will then use full scale CFD simulations to predict debris effects for a diverse set of debris and bridge scenarios. This research will is interested in mainly evaluating the interactions between model parameters such as bridge span and pier width that largely determine the two quantities of interest – flow velocities and pressures. Results from the CFD models, which will include flow velocities around piers and abutments, and pressure distributions on the bridge superstructure, will be compiled for use in Phase 3.
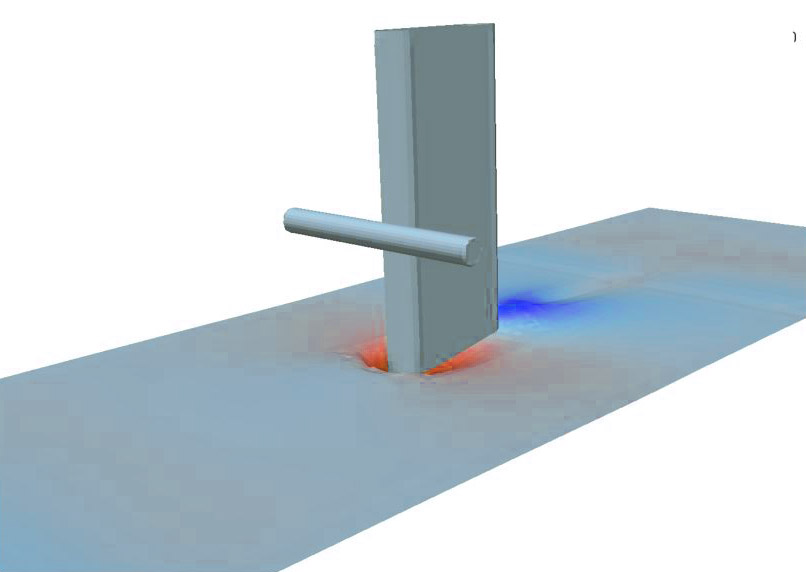
In the following results from a sample CFD simulation (using OpenFOAM) is shown.
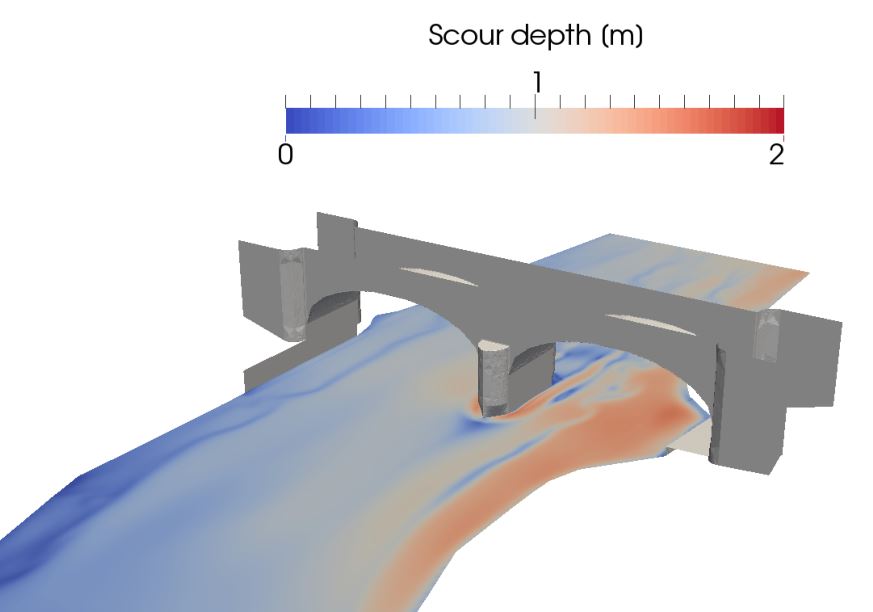
In the following simulated scour maps for a two-span arch bridge is shown.
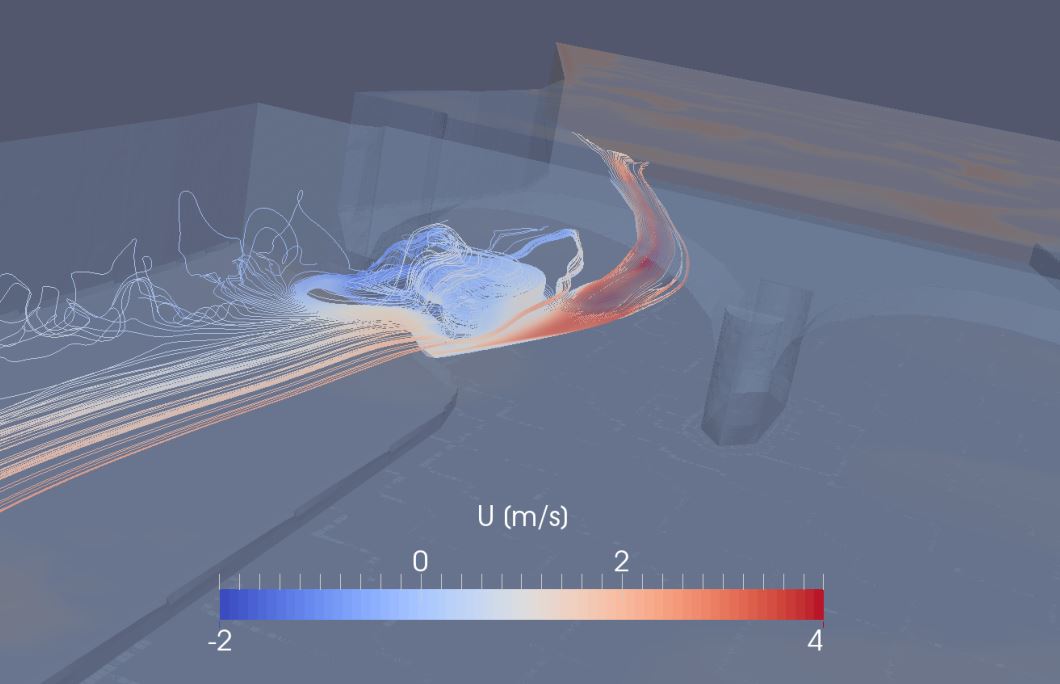
And a looking upstream view of flow streamlines:
Phase 3. Assessment guidance development
This phase focuses on the development of a new model for assessing debris-induced scour at bridges. This method integrates with current approaches to improve scour estimations at bridge piers. RAMB project also provides insights for evaluating hydrodynamic pressure at arch bridges.
Effect of debris on scour
To include effect of debris accumulation on local scour depth, we propose a new model instead of “equivalent pier width” approach. This will enable a more accurate and realistic estimation of the depth of local scour with debris accumulation. The proposed model is developed using not only data from our in-house flume experiments, but also most of available experimental data in literature. Also, in contrast to the “equivalent pier width” method, the model is not restricted to floating debris but is also applicable to cases where debris is submerged or resting on the bed.
We introduce a new factor Φdebris, derived via multivariate regression analysis, to be incorporated into any scour estimation equation. For instance, equation in CIRIA C742 will be modified as
Ys/Bs = Φshape.Φdepth.Φvelocity.Φangle.Φdebris
where Ys = scour depth; Bs = pier width; and Φdebris is a debris factor identified based on debris dimensions and elevation.
Hydrodynamic pressure on the arch sofit
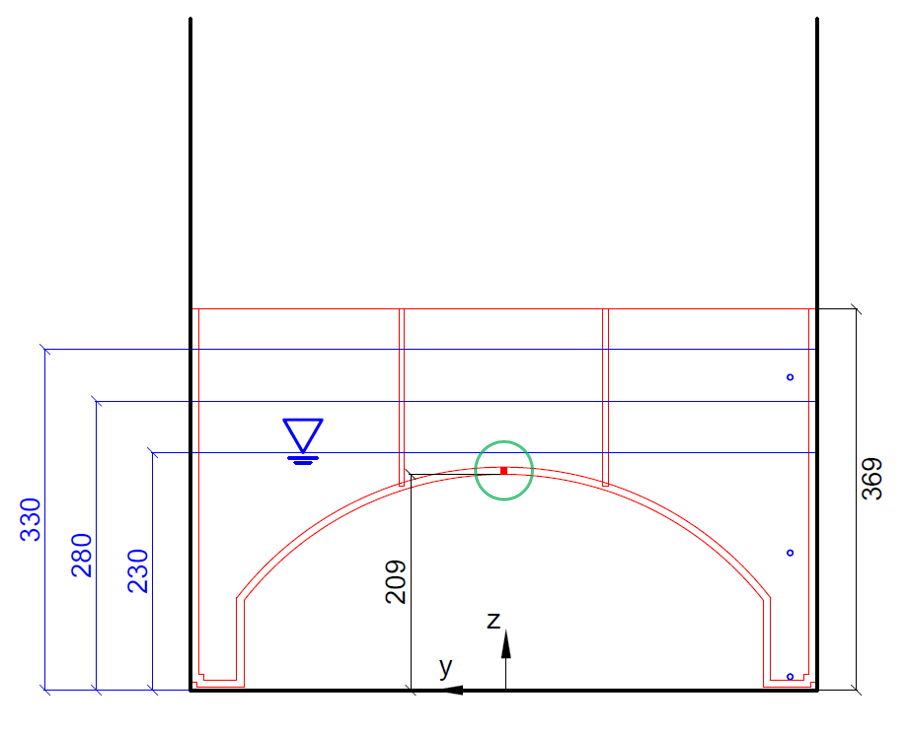
We have studied hydrodynamic pressures at a single span arch bridge under inundation conditions using a 1:10 scaled model (following schematic). We particularly measured hydrodynamic pressures at the arch soffit surface (enclosed by green circle in the following figure) using miniature pressure transducers.
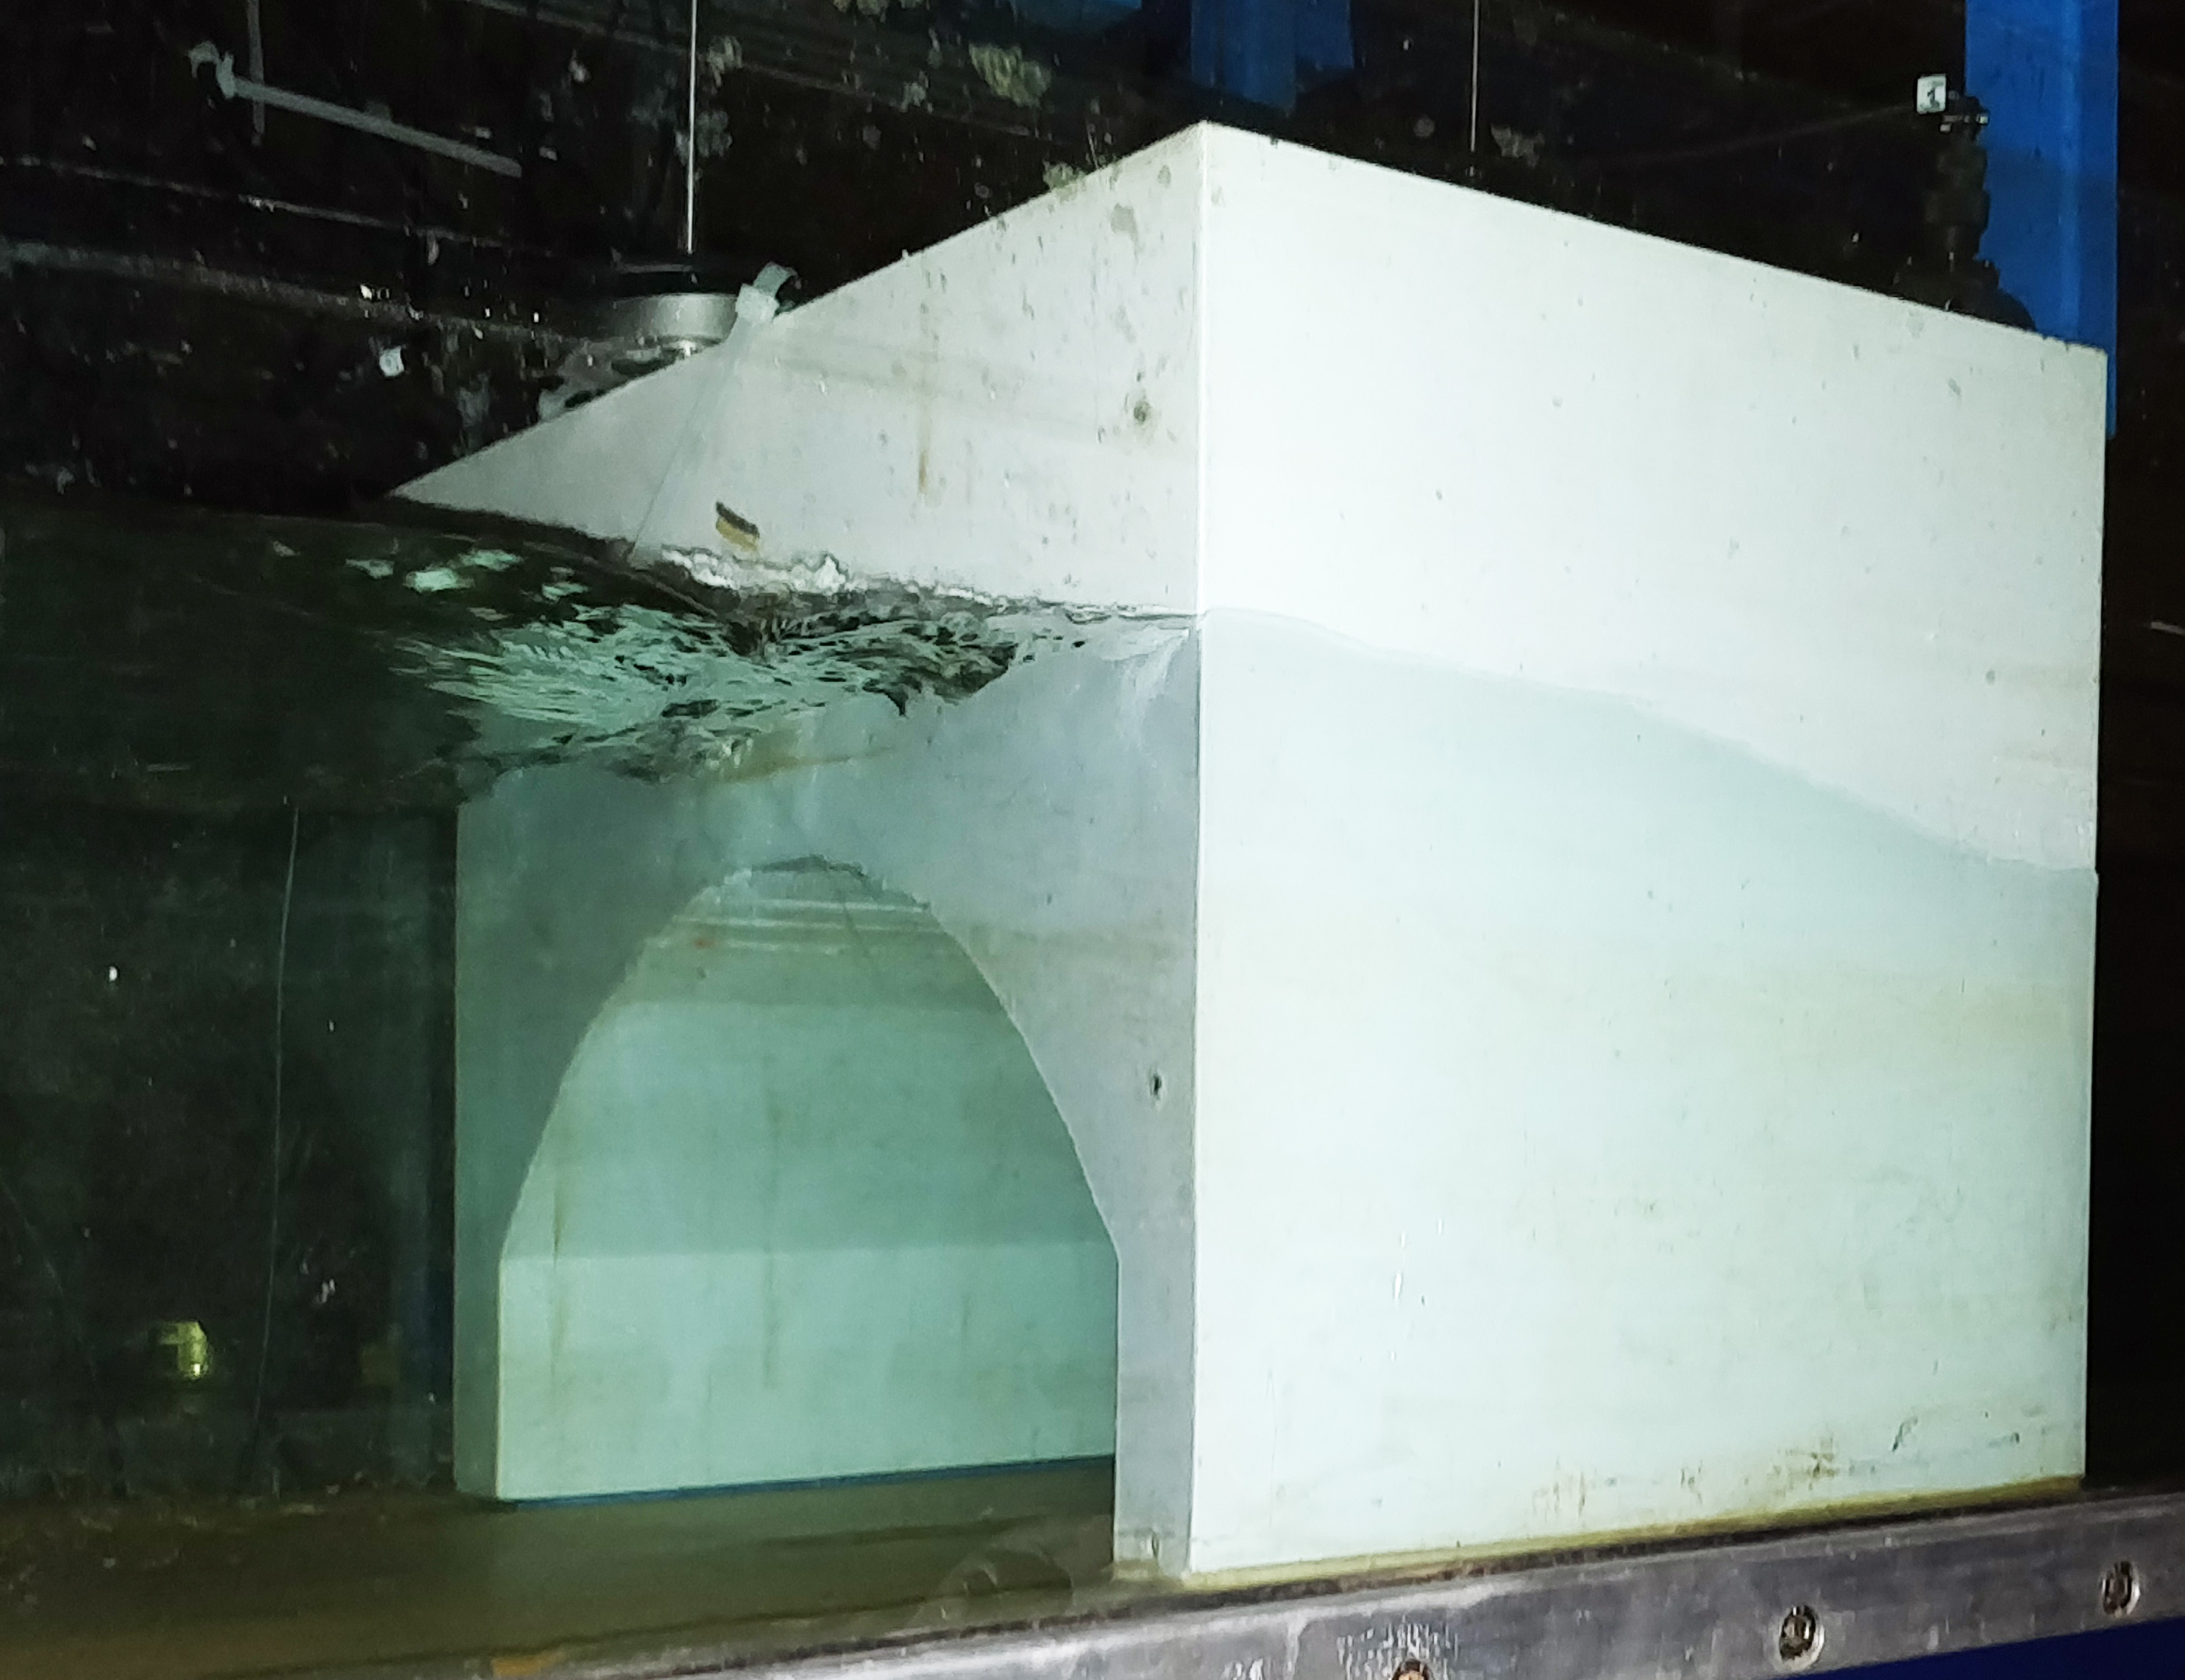
We detected large negative pressure (suction in order of upto ~ 3 times the hydrostatic pressure) at the surface of arch soffit. This was a rather surprising finding since negative pressure was not detactable by underwater visual inspection. We identified this to be matching with the observations by practitioners who have diagnosed arch soffit surface often prone to suction and mortar loss. Based on this, we are proposing to do closer post-flood inspection of this location to detect any likely mortar loss and repair it before affecting the structural integrity of the bridge.
Sample results
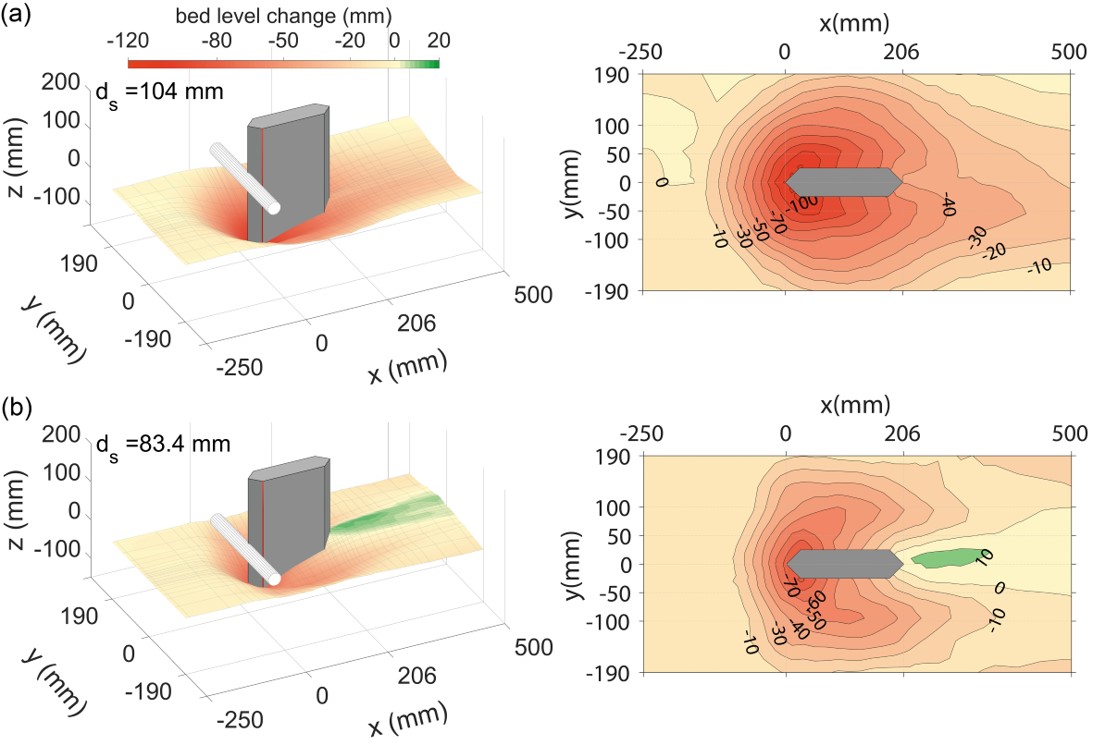
Scour maps in single-pier experiments with a log debris at free surface (top) and on bed (bottom). Flow is from left to right.
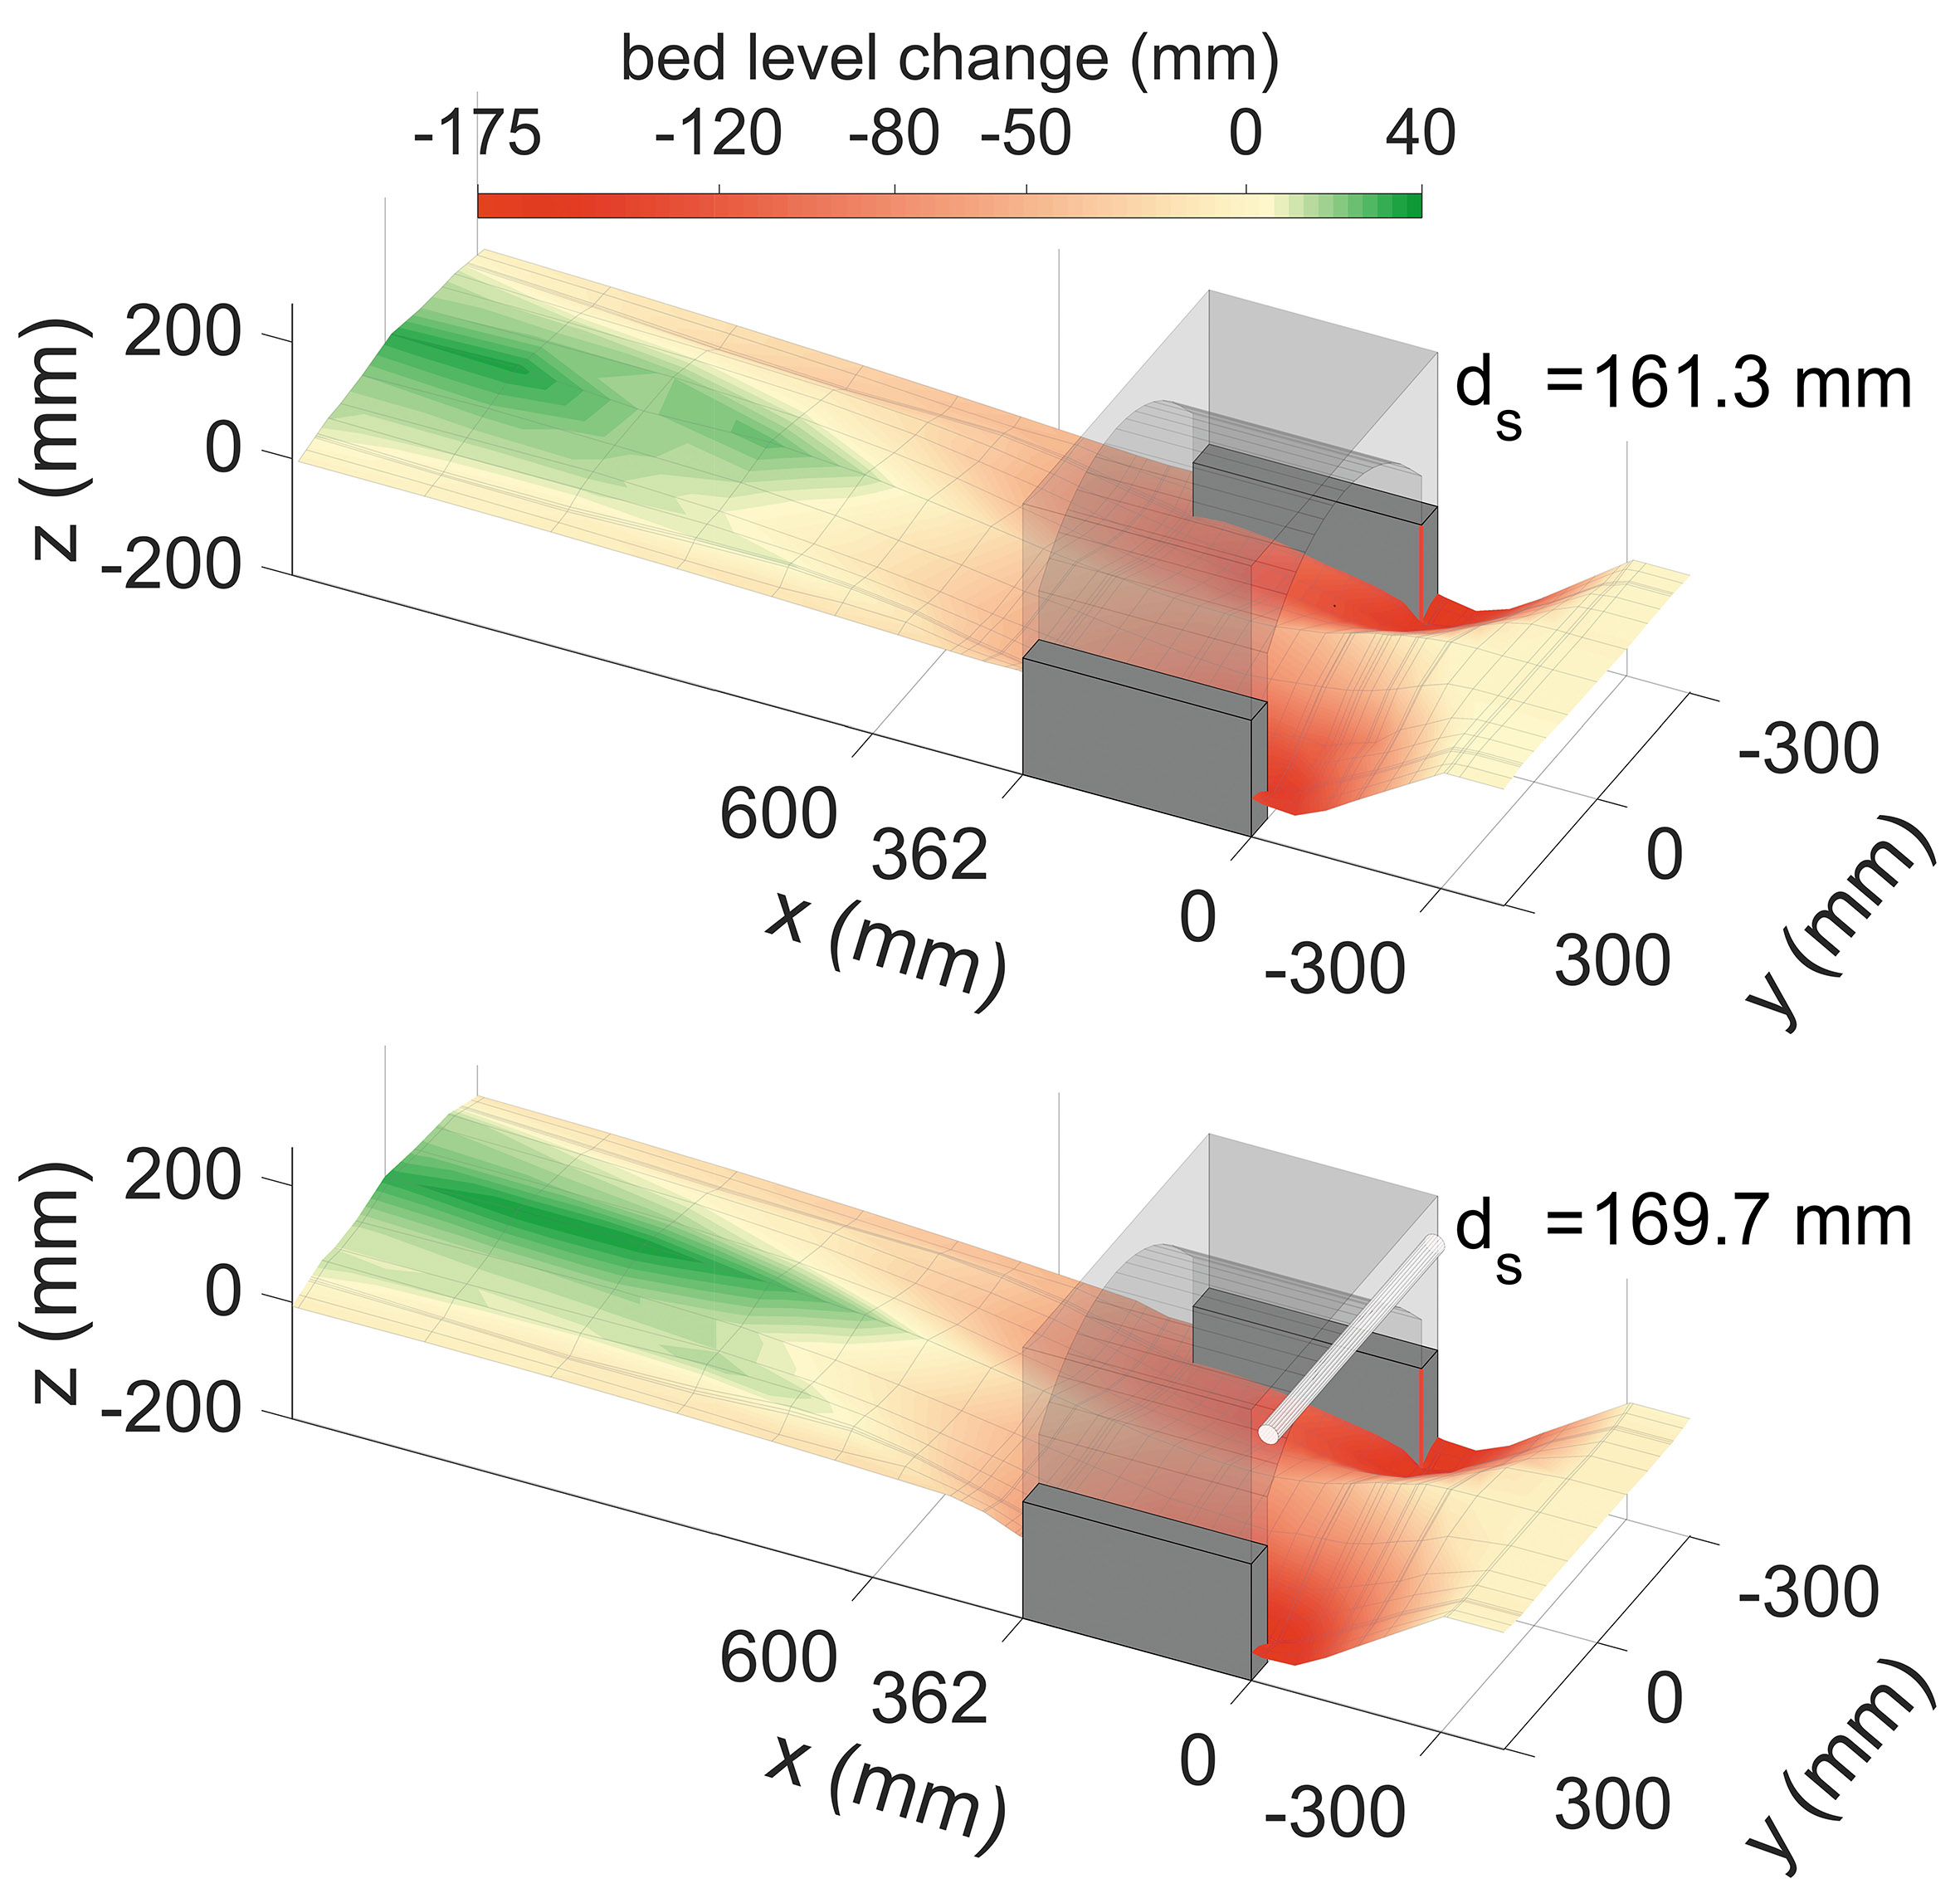
Scour maps in single span-arch experiments with and without log debris . Flow is from right to left.
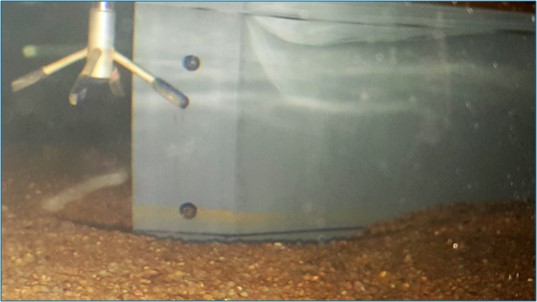
Followings are a few photos showing our recent activities in flume experiments (flow is from right to left).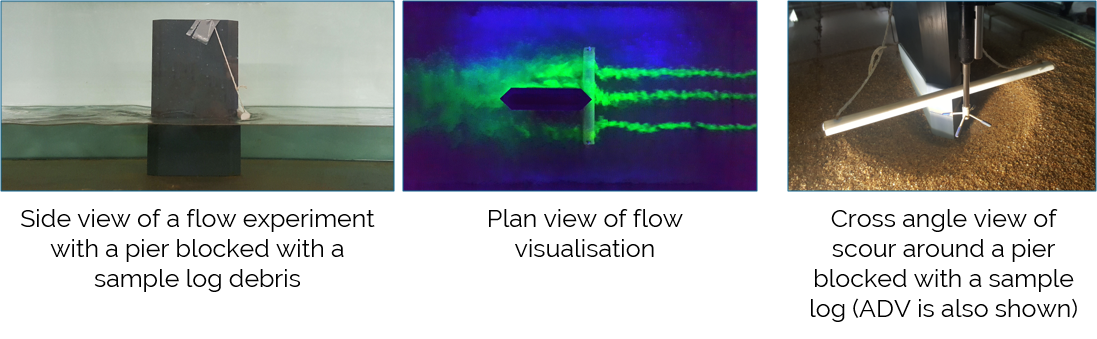
Following photo illustrates pressure sensors embedded in a pier model for measuring hydrodynamic pressure (acoustic Doppler velocimeter (ADV) can be also seen on the left side).
Velocity vector field measured around a pier using ADV. 
Power spectral density plot at a point adjacent to the bridge pier.

Scour protection using riprap around a pier blocked by a log debris (not shown in the image). Flow is from left to right.

Flume experiments
In this phase of the project, a series of flume experiments will be performed in a 0.605m wide flume with 10m-long working section using scaled models of potential obstructions to determine the effects of debris on flow and scour.
The experiments are not perfectly representing prototype conditions but are mainly for development and validation purposes in second phase of the project (i.e. computational modelling). Nevertheless, hydraulic conditions of the experiments were designed, to the degree that the conditions allow, based on Froude similarity between scaled model and prototype.
Considering the constraint of the flume width, which is 60.5cm, a single pier or short-span masonry bridge will be modelled. The existence of the bridge arches in is mainly aimed at measuring hydrodynamic forces on the bridge. Non-cohesive sediment (silica sand) is used as the alluvial bed material. Bridge model and debris models are created by 3d printing.
Following parameters are measured during the experiments or when the scour reaches equilibrium stage.
1. Flow velocities: using acoustic Doppler velocimeter;
2. Scour geometry: using echo-sounding concept;
3. Hydrodynamic pressure: using pressure sensors embedded insider the models; and
4. Uplift and lateral forces on the bridge model: using load cells with strain gauge.
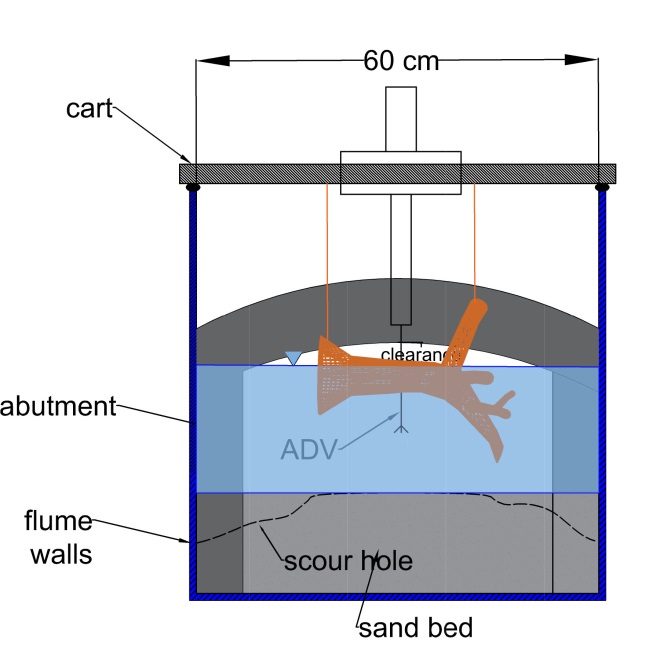
Cross-sectional schematic of flume experiments

Side-view schematic of flume experiments