
BioSpec
BioSpec
Multivariate statistical analysis techniques, such as principal components analysis (PCA) and k-means cluster analysis, are utilised with Matlab to reduce data size whilst retaining the useful information.
Raman and infrared spectroscopy are able to probe the various elements that make up the tissues of the body, such as lipids and proteins. However, the resulting spectra are complex and multivariate. Consequently, the raw data produced using these techniques can be difficult to interpret.
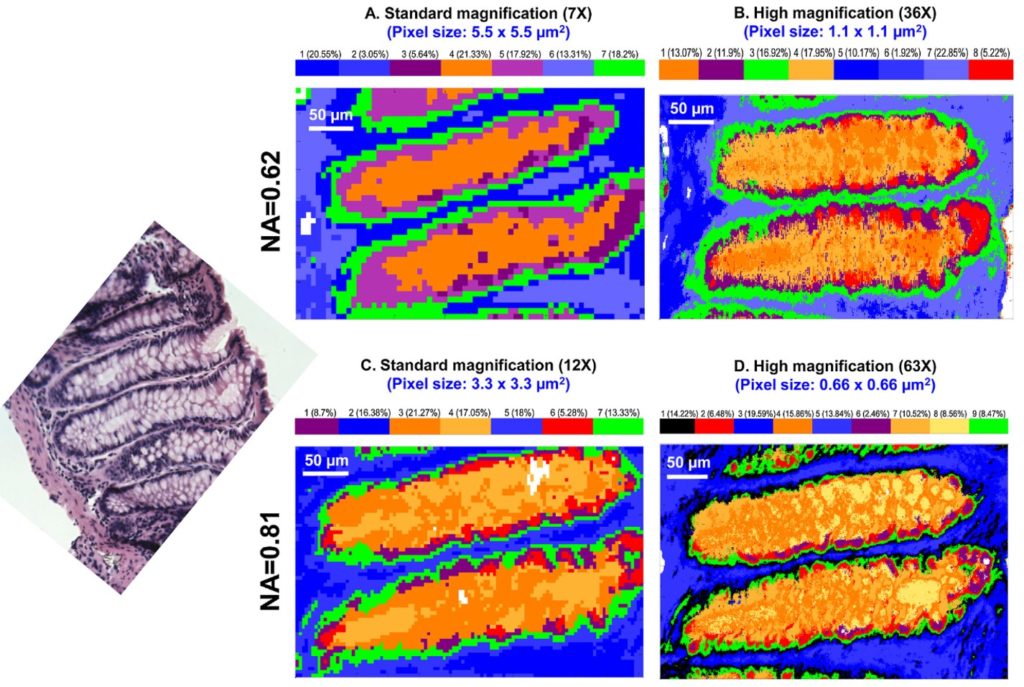
PCA describes the variance in the data. The first PC accounts for the largest amount of variance, the second for the largest variance of the remaining, uncorrelated data, and so on. The result is a set of ‘scores’ and ‘loadings’ for each PC, representing colours to visually identify regions within the tissue.
Image shows IR identified regions Nallala, J. et al (2016) Enhanced spectral histology in the colon using high-magnification benchtop FTIR imaging, Vibrational Spectroscopy