Author – Jen Lewis, PhD researcher
This blog originally featured on fabiogeography.com.
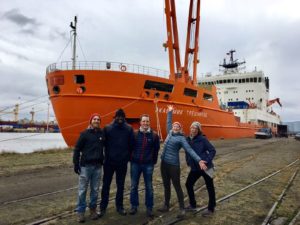
Last year (I can’t believe it’s been a whole year!) I was lucky enough to be awarded a scholarship to attend a one off opportunity, the ACE Maritime University. The scene for this month long ‘floating university’ was the Eastern Atlantic Ocean, aboard the Russian Polar Research Vessel Akademik Treshnikov.
On the 19th of November 2016, 49 students and 16 scientists from 20 different nationalities joined the ship in Bremerhaven, Germany for Leg 0 of the Antarctic Circumnavigation Expedition. Over 27 days we sailed down across the equator, to Cape Town, South Africa. ACE was a
privately funded expedition, that went on to circumnavigate the continent of Antarctica last summer, visiting the islands, measuring things like marine mammal populations, ocean acidification, carbon dioxide dynamics and marine plastic distribution. There were 22 different research projects, and if you want to read more about them then check out the ACE expedition website and blog.
The aim of the course was to bring together a global group of young researchers and introduce marine science as a cross-disciplinary field. Days were full of lectures on various principles of oceanography, or how to use different type of ocean monitoring instrumentation.
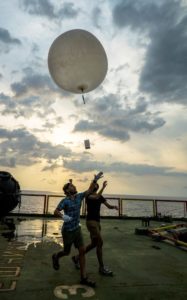
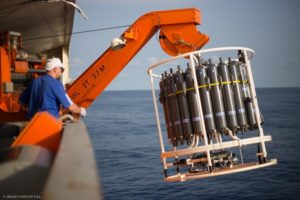
We even had homework every other day! We also took part in daily deck work with the different projects that were setting up for the Antarctic legs. This included things like assisting with the CTD deployment, processing data, collecting water samples and filtering them. Highlights included working with Florian and Yajuan to make a film about their research investigating microbial and plankton communities that have big influences on primary production and the carbon cycle, seeing the different layers of biomass on the echosounder display, and also setting up and deploying a radiosonde balloon that measures the atmosphere.
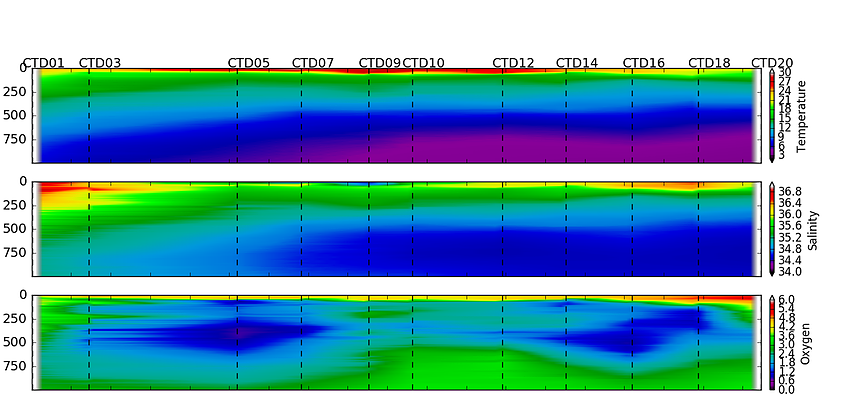
As part of a personal project, I was also filtering seawater samples from different depths from the CTD casts every day. These samples are being used to look at the difference in species diversity through the North to the South Atlantic, by looking for traces of DNA that has been left in the water by different species that are in the area at different depths – so watch this space!