Sample results

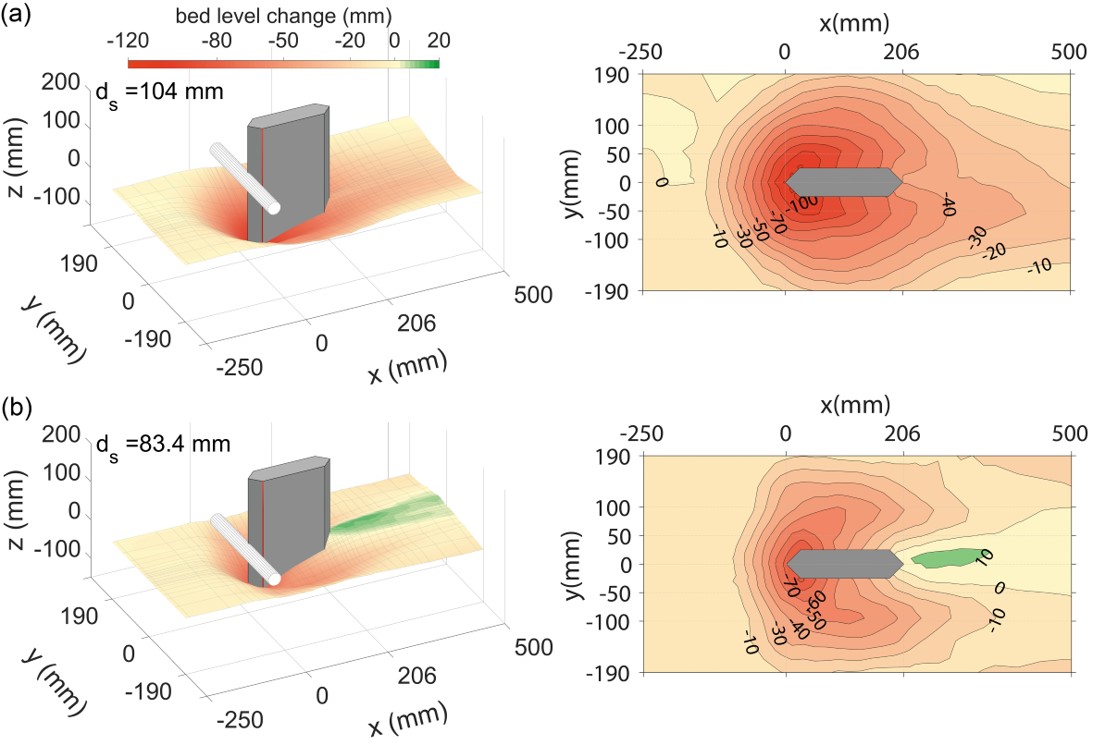
Scour maps in single-pier experiments with a log debris at free surface (top) and on bed (bottom). Flow is from left to right.

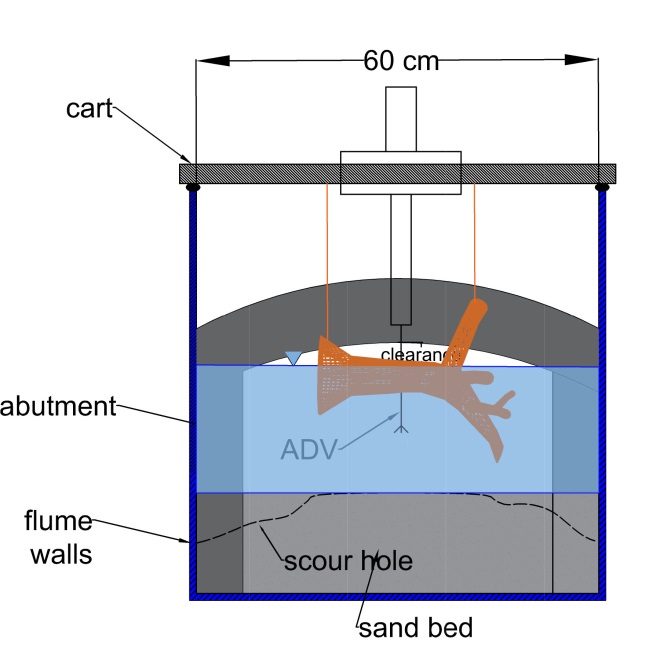
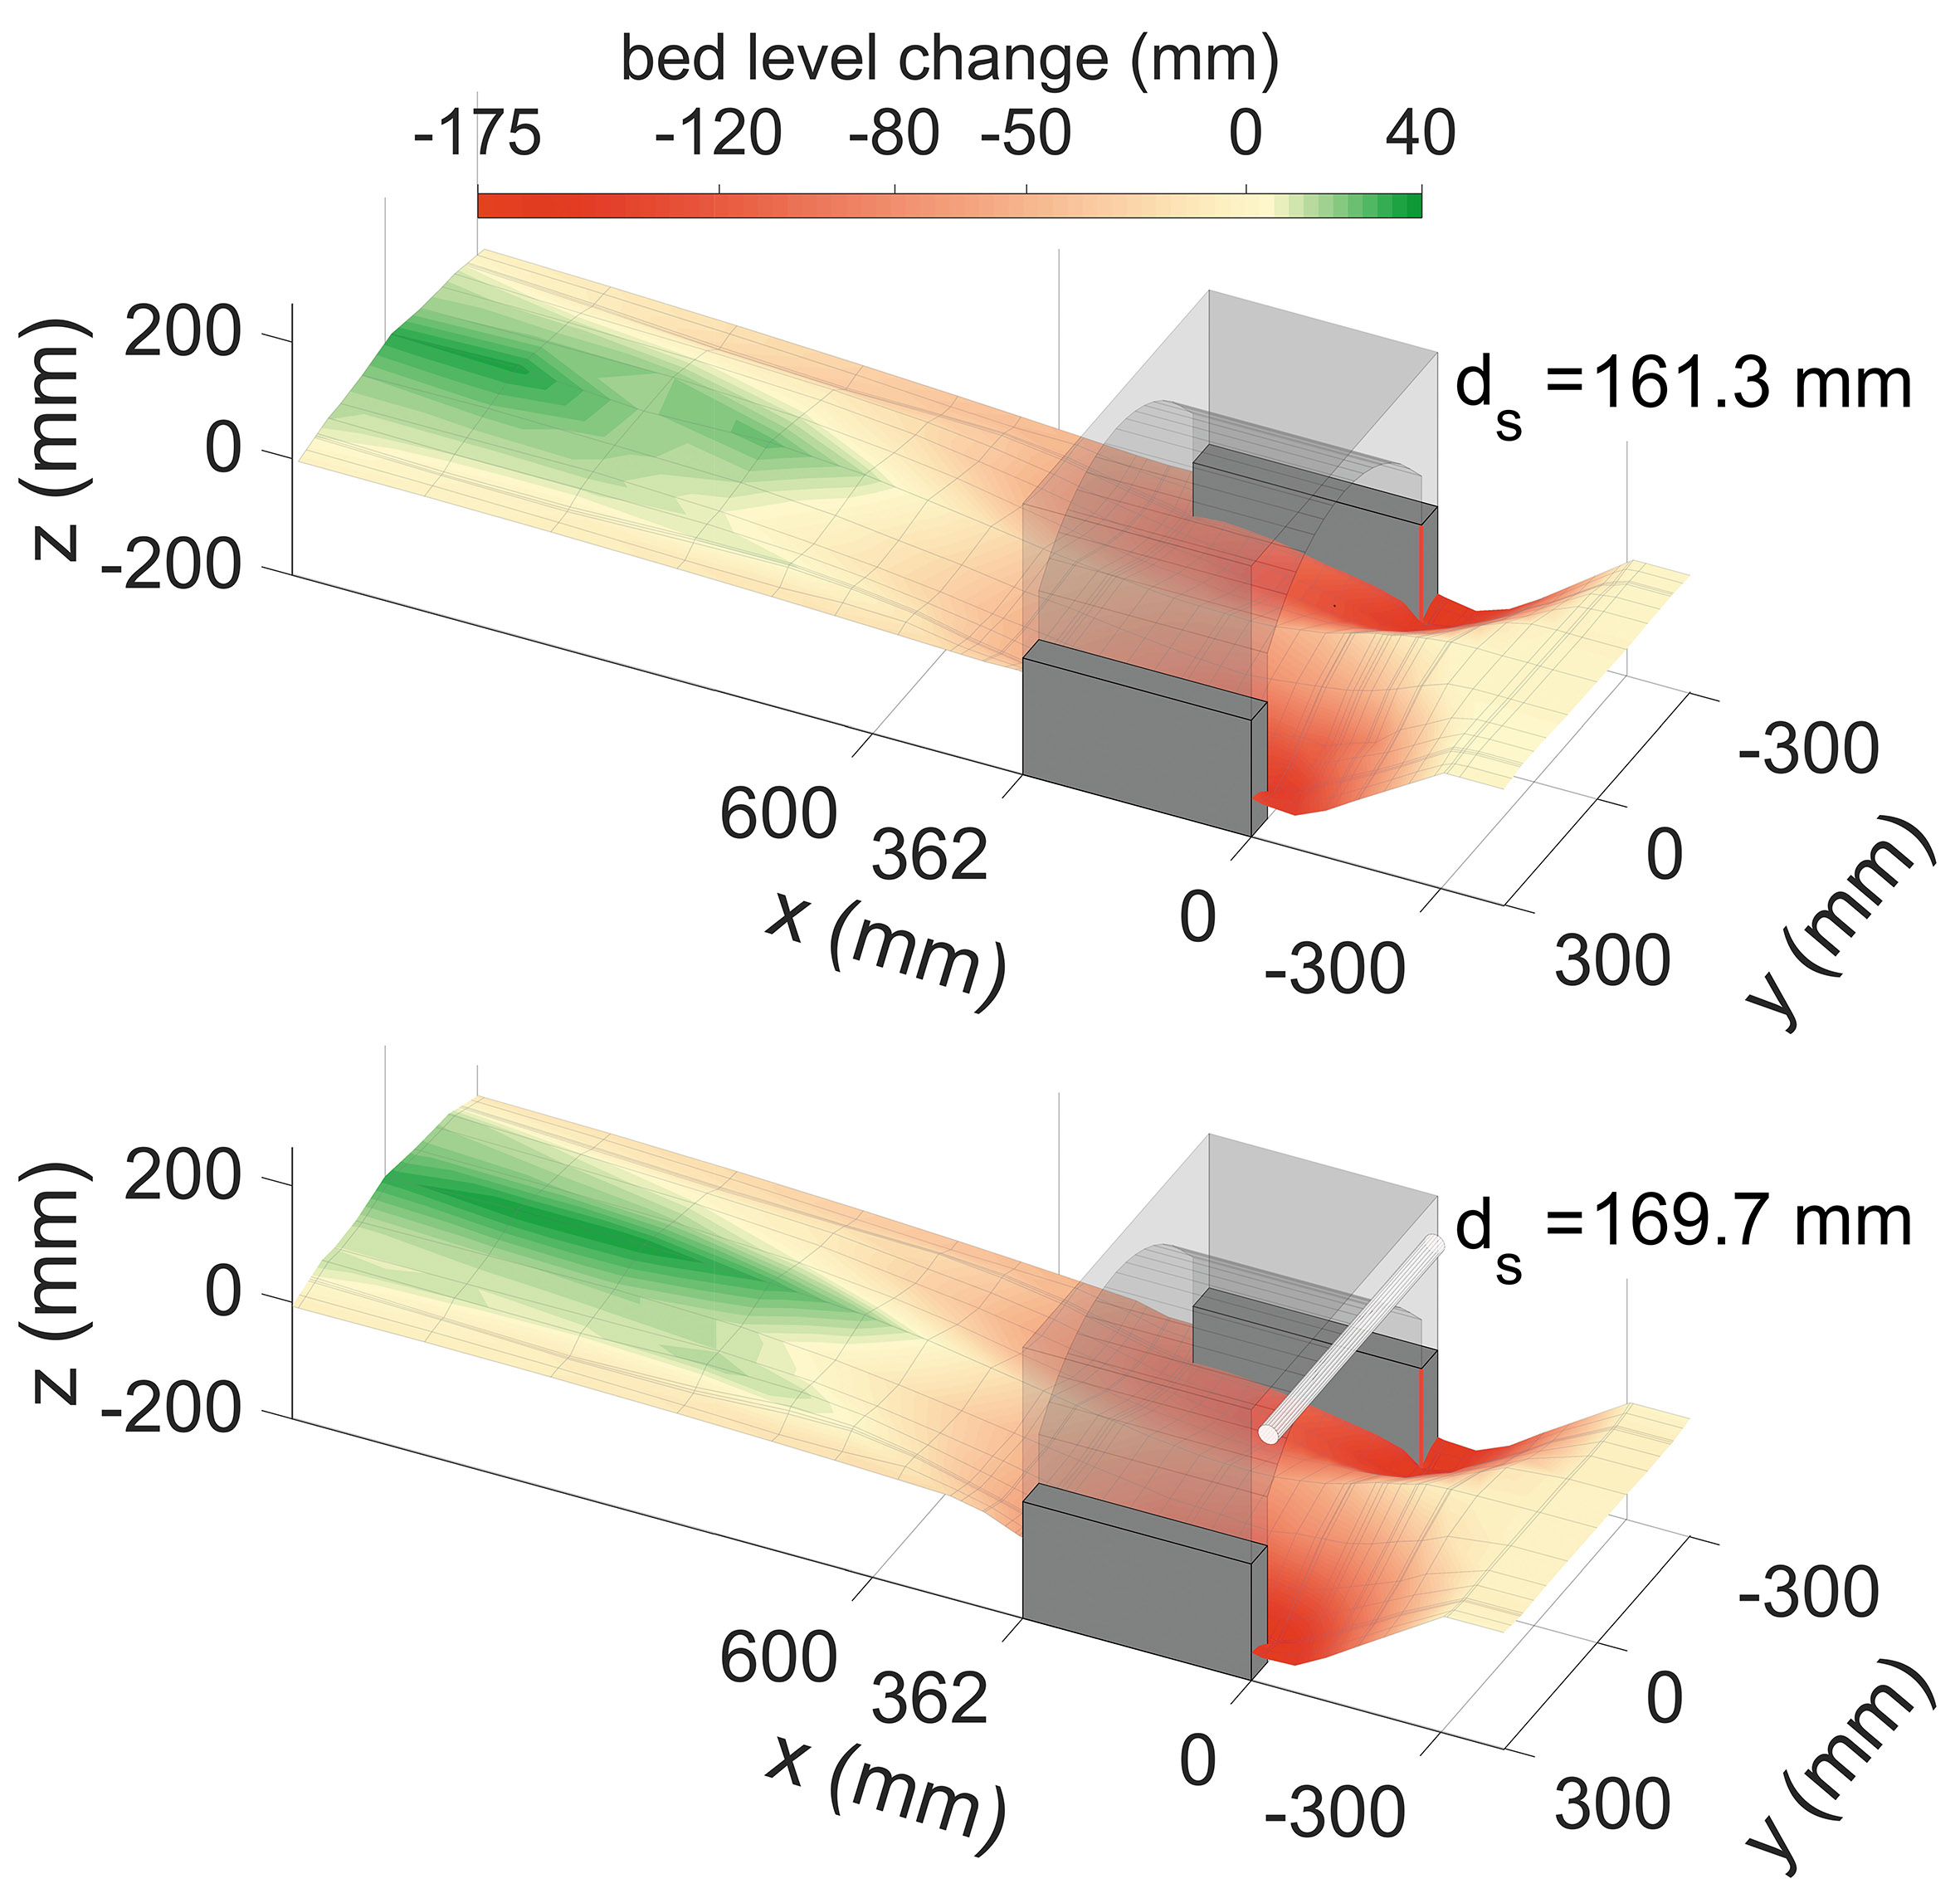
Scour maps in single span-arch experiments with and without log debris . Flow is from right to left.

Followings are a few photos showing our recent activities in flume experiments (flow is from right to left).Lab photos

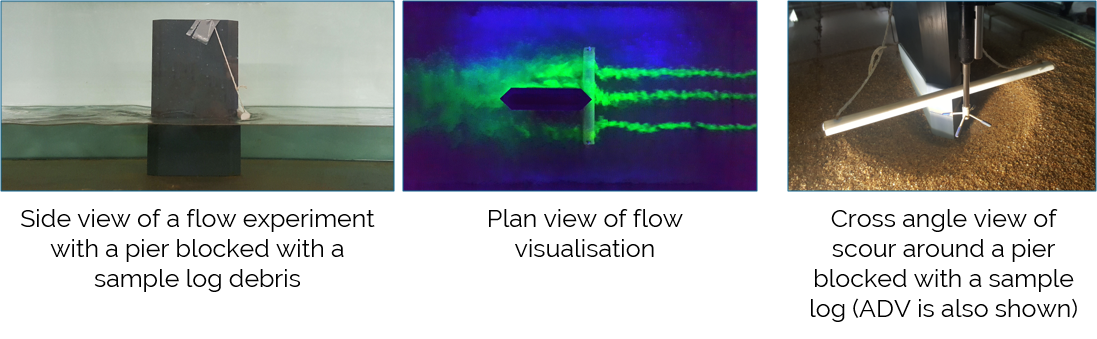
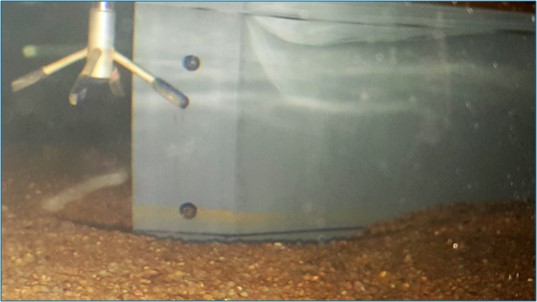
Following photo illustrates pressure sensors embedded in a pier model for measuring hydrodynamic pressure (acoustic Doppler velocimeter (ADV) can be also seen on the left side).

Picture1

Velocity vector field measured around a pier using ADV. Picture2

Power spectral density plot at a point adjacent to the bridge pier.

Scour protection using riprap around a pier blocked by a log debris (not shown in the image). Flow is from left to right.

Flume experiments

In this phase of the project, a series of flume experiments will be performed in a 0.605m wide flume with 10m-long working section using scaled models of potential obstructions to determine the effects of debris on flow and scour.

The experiments are not perfectly representing prototype conditions but are mainly for development and validation purposes in second phase of the project (i.e. computational modelling). Nevertheless, hydraulic conditions of the experiments were designed, to the degree that the conditions allow, based on Froude similarity between scaled model and prototype.

Considering the constraint of the flume width, which is 60.5cm, a single pier or short-span masonry bridge will be modelled. The existence of the bridge arches in is mainly aimed at measuring hydrodynamic forces on the bridge. Non-cohesive sediment (silica sand) is used as the alluvial bed material. Bridge model and debris models are created by 3d printing.

Following parameters are measured during the experiments or when the scour reaches equilibrium stage.

1. Flow velocities: using acoustic Doppler velocimeter;

2. Scour geometry: using echo-sounding concept;

3. Hydrodynamic pressure: using pressure sensors embedded insider the models; and

4. Uplift and lateral forces on the bridge model: using load cells with strain gauge.

CS1

Cross-sectional schematic of flume experiments

CS_side view

Side-view schematic of flume experiments