This is part 2 of the blog series on Ginny’s forthcoming book due this month!
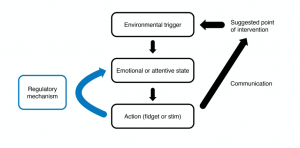
Figure 6: Prototype diagram from our Stimming article. Read the full article here.
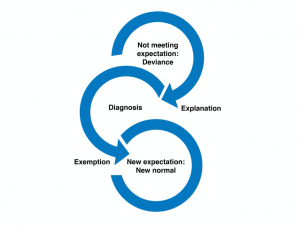
Figure 7: This figure considers the function of diagnosis of psychiatric conditions
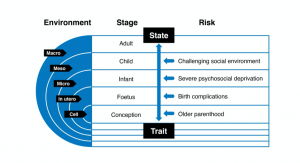
Figure 8: The below diagram is a conceptualisation of some antecedents of autistic behavioural states versus autistic traits.
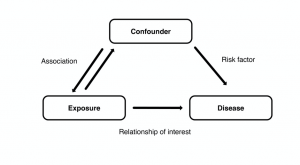
Figure 9: This diagram helps to explain confounding in epidemiology – correlation is not causality!
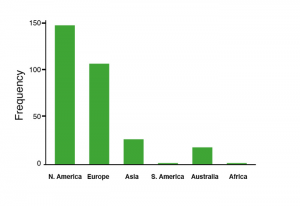
Figure 10: Our review in Molecular Autism shows 85% of autism research from North America and Europe – we need more international studies!
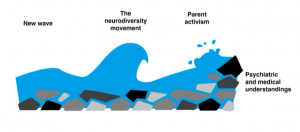
Figure 11: This figure is a representation of thinking about the various autism activist movements as waves


